Simplify calibration of your Agile Estimates

Back when I managed waterfall development teams, I had a secret technique that almost always meant my projects came in on time. It was simple but uncannily accurate, although management regarded my delivery timescales as conservative, flaky or downright dumb when I initially published them. As usual, developers would take the Functional Specification that the Technical Architect had prepared from the Requirements Specification and estimate unit coding and test time. The Test Team would estimate tasks like system testing and UAT. This used the estimating technique of Expert Opinion.
All these components I would pump into my Gantt chart, which spewed out a notional end date at the bottom. Then I applied my secret formula to this rough first cut of the plan. An uplift of 150% on the elapsed time. Crazy? Well, I guess it was a reflection on the flaws of the waterfall approach. It was also a crude attempt at calibration based on experience. Regardless, it produced vastly more accurate estimates than had I not used calibration.

Agile has changed all that and for the better as regards accuracy of estimates and timely deliveries. Even so, many people shy away from putting their neck on the block and publishing hard and fast estimates. It’s usually the poor Product Owner who gets it in the neck if they are way off base. However, estimating is still difficult to get right – even with easy-to-use methods favored by Agile teams. Calibrating, as we shall see, is a vital factor, which can be made easier by using the right tool.

By contrast, the Product Owner is mainly inward looking. The Product Owner is permanently attached to a development team or teams and is primarily interested in delivering sprints. That involves managing and scheduling the backlog of stories, shuffling resources, monitoring adherence to quality in all aspects of the lifecycle and ultimately delivering clean deliverables that fulfil users’ requirements.

In many smaller companies, the two roles become blurred. Most often, a Product Owner is the equivalent of the conventional business analyst role, extracting requirements from users, interpreting them in technical development terms and pumping them at the development teams to drive the construction process.

The Product Owner is very much aware of the product roadmap and vision but, in these conventional definitions of the roles, does not develop that roadmap and neither should they. However, in practice, many Product Owners attempt to bridge the gap by obtaining a comprehensive grasp of market requirements from knowledge of multiple customers and then educate their teams so that they have a deep appreciation of the commercial side as well as the functional.

Conventional estimating techniques valid for Agile projects

When assessing stories in the backlog, a team may use one of these methods to provide relative estimates for each story:

  • Expert Opinion, as described above
  • Disaggregation, or splitting a story or features into smaller, easier-to-estimate pieces
  • Analogy, which uses comparisons with previous projects, or with functionality previously developed by the team
    • Identify the significant characteristics of the project, such as complexity, size and so on.
    • Put estimates around these characteristics.
    • Find some completed projects that can be compared to this project.
    • Then do a comparison of the main characteristics of this project with the same attributes of the past projects.
    • Calculate an estimate based on the similarities and the differences.

Estimating

So, what is so different about the agile approach that improves estimating? Two aspects in particular:

  • Timeboxed iterations (sprints), typically between 1 week for extreme programming to maybe 4 weeks for a Scrum approach. That is a long way short of planning a 6 month or even a 2 year waterfall delivery.
  • Relative story points (relative sizing) – by assigning each function (story) a notional unit of value corresponding to effort (story point) we can think of an iteration as a box. This box measures, say 2 weeks long by 6 resources wide.

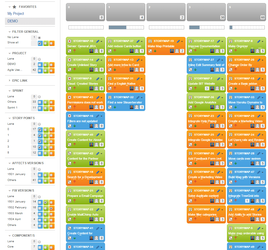
Estimating then becomes a question of how many story points (effort units) can we fit into this time box (iteration). Estimating also depends on good calibration – getting your relative estimate reasonably right. This is where a tool such as Agile User Story Map really helps by providing “visual buckets” or drawers filled with story points of the same relative size. The aspect that almost everybody has difficulty in getting their head around is the concept of units of relative effort.

The best analogy I know is Mike Cohn’s story of two people looking at a building that is some way away. One says it will take 10 minutes to get there. The other is on crutches and so reckons it will take 20 minutes. Both are equally valid. An agile team collectively might assign value (story point) of 1 to this speed point as being a really simple task. Every other story in the backlog (prioritized features list) would eventually be assigned story points based on this original reference story.

That is an extremely simplistic example. In real life, teams usually come together to collectively baseline reference stories. Experience has shown that it requires maybe 12 or more stories to be assessed to form a baseline reference. Not everybody will fully understand all of the effort involved to deliver those stories, but most people will. Typically, they will seek out a number of stories of similar effort value around the 2 level.

That leaves scope below for really simple tasks, or collections of minor tasks, that can be assigned as 1. Then every story of greater complexity will be compared to the reference stories for value 2 and assigned a higher story point. The end result is a set of baselined reference stories and relative story points.

Value units used in story points

When estimating relative size points for stories, teams use simple measurements to express their opinion of the estimate. Some of the most popular are:

  • T-shirt sizes, corresponding to Small, Medium, Large and Extra Large, are the simplest measurements used and are easily understood.
  • Powers of – uses the values 2, 4, 8, 16 . .
  • Fibonacci sequence – uses the values 1, 2, 3 , 5, 8, 13 . . .

Having too many possible values is bad because people have to think too hard. You want to make estimating fast and fairly easy. I found that 5 options is a good number, with a sixth level for the stuff that is perhaps too complex to assess quickly. That fits neatly with a Fibonacci sequence where the highest value is 13.

Planning Poker

Planning poker is a planning meeting where participants give their estimate for each story by choosing a card with a value printed on it. All participants then reveal their cards at the same time. Then they have an opportunity to explain the thinking behind their evaluation, which may reveal aspects that others had not considered. Finally, all participants are then asked to make a revised estimate and once again all show their cards simultaneously. Not only is it a very effective technique but it also adds an element of fun to the proceedings.

Problem

User stories with the same story point values should have the same complexity or the same effort. However, after a couple of estimation sessions, the team loses sight of the values of the “reference stories”. When this happens, you will find that drawers with a certain complexity label contain stories of different sizes.

Solution

Calibration/normalization of the team’s estimation. For each story point value, the team must have a reference story, or ideally several reference stories. After a new story has been estimated, it has to be compared with the reference story.


Agile User Story Map helps to visualize the contents of all the different drawers and allows the Product Owner to re-estimate a story simply by moving the card into a different column. In this way you can ensure that stories of the same size also have the same estimation label – fast and easy calibration.

Problem

After a couple of iterations, teams tend to favor the story point value of one particular story. I observed teams where every second story was given this same story point value.

Solution

Agile User Story Map provides a visualization of this drawback and gives the Product Owner a good sense of just how complex the stories are.

Agile User Story Map helps to visualize the contents of all the different drawers and allows the Product Owner to re-estimate a story simply by moving the card into a different column. In this way you can ensure that stories of the same size also have the same estimation label – fast and easy calibration.