Roadmap Planning Made Easy (or easier!)

All too often, the start of a large project is characterized by a type of fog. Nothing is clear except for a large volume of epics, stories and issues that immediately form the backlog. The product owner needs to start defining priorities, sprints and the eventual roadmap. The business wants to see the overall scope and estimated delivery times. Development teams need to know what elements are critical and where to start.

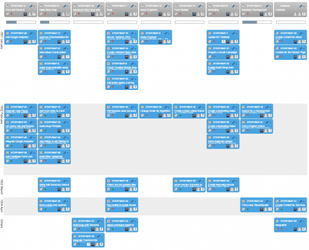
The emerging preferred solution is to deploy a clear, yet simple story map that conveys the key information visually at a glance. Furthermore, elements can be moved around easily as the overall plan takes shape. It forms a central “truth board” that all stakeholders can access, appreciate and challenge if necessary.

Jeff Patton described the core approach in his article “The New User Story Backlog Is a Map”. All I have done here is overlaid that with my own experience of Roadmap Planning.

The story map should help to define functionality, identify gaps and enable planning.

A good story mapping tool works on all levels and enable you to organize: individual stories by functionality, theme or application areas application areas into projects it also maps versions and releases it maps sprints by versions it maps releases by projects => program management and visualizes a wider scope

In this way all stake holders keep track of the product’s big picture. It means a user can easily drill down from program level to uncover all the layers and individual components. That is true usability and communication. It’s your roadmap at a glance.

So – how do we get from a jumble of stories in the backlog to the promised land of a road map?

From a jumble of stories to a road map

Step 1: The Grid Organize the stories by functional headings across the X-axis so that the stories site below each heading that they belong under. Headings can be by application or theme or whatever grouping is appropriate.

Priority functions come first at the left hand side so that reading the story map from left to right indicates a series of diminishing priorities. Similarly, the priority stories are closest to the top of the column underneath each heading.

Initially, you may insert anything you want into the grid, such as enhancements, estimates or just raw ideas. The important aspect is to get as much relevant information as possible into the grid.

Step 2: Slicing and Dicing Now the elements have been grouped by functionality it’s time to slice it up. Let’s prioritize the backlog on our story map.

Remember that a story map is continually changing. It’s an organic beast that provides flexibility to match the agile approach.

I have learned that the best approach is to stay ahead of the game by high level prioritization of maybe three or four sprints ahead of the next sprint. I say high level because they invariable change before I have to plan the next sprint at a low level. New stories, issues and enhancements appear almost daily sometimes


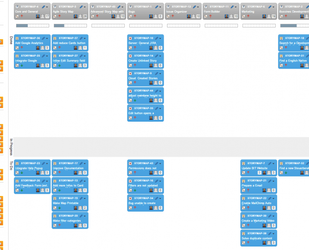
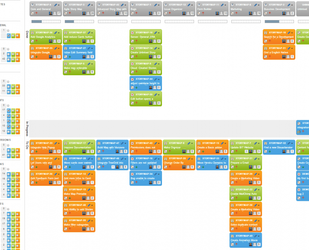
On the right you will see one of my road maps, sanitized for confidentiality. Note how it changes as we went through the development process.

Ready to start sprinting:

A little more mature after a few sprints:

I use color a lot because it is instantly recognizable and clearly indicates certain characteristics. There are no hard and fast rules for what colors represent but I found it’s vital to ensure that all projects and teams in an organization standardize on some convention.

For example, in my story map here I use green to highlight complexity, blue for recently added functionality, orange for business issues.

What I found was that stakeholders really appreciated the benefits of the tool because straight away they could see the progress points that indicate what has been completed, what is currently under development and what the next steps are.

My teams easily highlight what they have built and delivered and quickly construct their approach for the next sprint.

It’s a given that the plans may change rapidly but that is part and parcel of the agile approach. This tool makes re-planning much easier with its visual story mapping approach.

Conclusion

I am a convert to the visual story map for my Roadmap Planning and wonder how we managed to succeed without it. It’s a genuine time saver apart from its primary communication and planning / re-planning benefits. Users and stakeholders now can’t live without it.